
Petroleum prices have broken through resistance that has held for several months. The next question is whether this will lead to investors ‘piling into’ crude and really driving the price upward toward 2008’s high of $147?
Is the money available?
If by that the questioner means in the real or main street economy, the answer would have to be no.
This chart is from John Williams’ Shadow Government Statistics: you can see the M1 increased as a result of Fed cash injections from the period post- Lehman collapse. The decline began last fall. M3 is continuing to shrink which represents diversion of funds toward deleveraging as well as the tightening of non- finance lending. Funds going toward fuel purchase at the higher prices are not going toward other business or investment, the same paradigm that has existed since 1998.
Getting credit for the average citizen is very costly. Costly credit plus costly energy cannot be good for the economy … can it?
Finance liquidity and money- like substances are available to flood into futures and spot markets which are leveraged derivatives markets capable of being moved by sentiment and hot money. How much more finance liquidity is available?
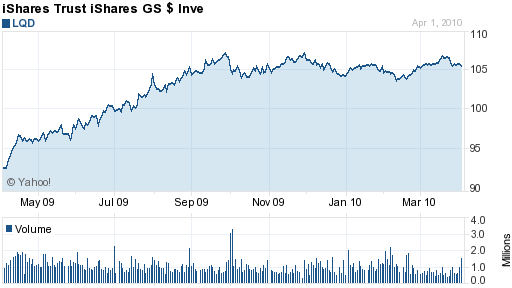
This chart from Yahoo Finance follows the LQD, an exchange traded fund that tracks corporate bond issuance. It doesn’t look as if much has changed over the last seven or eight months. It is hard to see how excess funds would flow from corporate borrowing into petroleum since high input prices cannot do them – corporations – any good.
Keep in mind, the backdrop for what is taking place now in the petroleum markets is the fact of dollar- for- dollar price peaking back in 1998. Oil prices have done nothing but increase since that time. The issue is whether the price rise will continue unabated or whether other economic factors will limit nominal price rises while still driving real – or dollar value adjusted – prices ever higher.
The second issue is whether action is being taken to remove any speculative activity from futures markets. In 2009, the suggestion was for the US to monetize its Strategic Reserve and ‘sell’ some of that oil into the futures markets. This, of course, is what has been described here on this blog as the strategy of the current ‘swing producer’ … who- or whatever that might be. The swing producer would balance the market between buyers and sellers and dampen volatility.
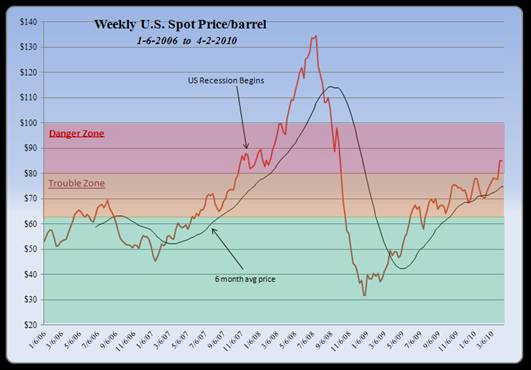
This chart is from Jim Hansen’s Master Resource Report. Hansen compares fuel prices to GDP and notes his price level indicator is in the danger zone right now. The last price foray at the end of 2007 had the recession beginning after about a month of super- high fuel prices. The fuel bubble lasted seven months before the crash, by then the recession was in full swing destroying demand in addition to that deterred by the high prices.
While the ordinary correlation is not causation’ warning is reasonable at this point, it is hard to see how increasingly expensive fuels can be a positive for any part of the the economy, oriented as it is around monetizing waste. At some point fuel becomes too valuable to waste anymore. It instead becomes a form or analog of currency.
One positive is that if the double dip is coincident to the current price run up, it will be hard for anyone to deny that the world’s economies are in the grip of peak oil.