… Giant mountains arise!
Finance analysts puzzle over the ongoing recession, in doing so they look at the cost of credit independent of the cost of fuel. They fail to consider the two items together, which is an error because the fuel bid above the very low historical mean is credit dependent. At $20 per barrel for crude, businesses can pay for fuel products out of cash flow because it represents a very small percentage of product cost. At the current market prices which are almost $100 per barrel above twenty dollars per barrel, businesses (and individuals) must borrow. Using available credit pushes the bid for fuel higher still which in turn makes fuel more credit dependent in a self-reinforcing cycle.
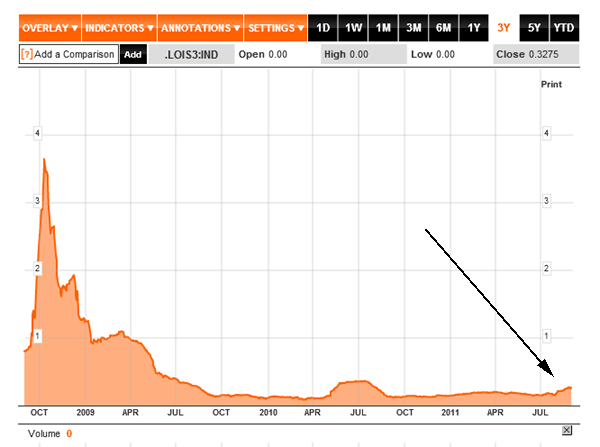
Demand pushes the price of credit upward. This cost must be added to the cost of fuel bought with credit. Since a distinction cannot be made between fuel-credit and non-fuel credit, the ordinary borrowers seeking non-fuel goods and services — such as bank bailouts — must bear the credit burden of increased demand and rising cost:
Figure 1: The three- year Libor-OIS spread (Bloomberg): whether conditions are ‘risk on’ or ‘risk off’ the spread — which represents demand for funds in money markets — increases. It’s a molehill now because there are trillion$ sloshing around in the money markets with zero deleveraging taking place. It may just be a coincidence that credit conditions are tightening because of ‘way high’ fuel costs, Dude!
All the little things added together become straws which break camels’ backs!
Higher credit costs are self-reinforcing: as the banks balk at lending to each other the demand for liquidity to meet redemptions and margin calls explodes. Debt repayment/deleveraging pairs or marries assets to liabilities on balance sheets annihilating liquidity: the money created by its being lent into existence vanishes as debts are paid. Unmet margin calls results in large asset value losses. The ‘run’ out of non-currency assets forms into a ‘mountain’ of credit cost.
As liquidity vanishes business and institutional balance sheets — which are entries on even larger balance sheets — are annihilated. This is the necessary and inevitable ‘jubilee’ contraction of the great excess of unserviceable credit.
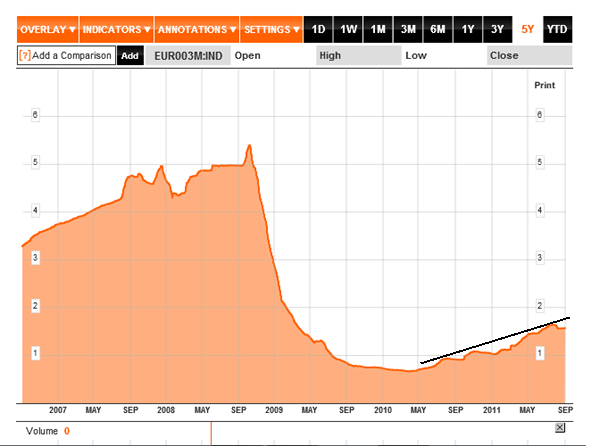
Here is the unmistakable and increasing demand for liquidity. Here is a five-year overview of the Euribor:
Figure 2: The Euribor uptrend is a consequence of Eurozone redemptions caused by austerity and confused economic policies in Europe … along with excruciatingly high fuel prices … Dude!
Perhaps this last is just coincidental: confusion by itself creates demand for ‘flight capital’. As in the US, of trillions of euros in liquidity-without-purpose has not solved any problems.
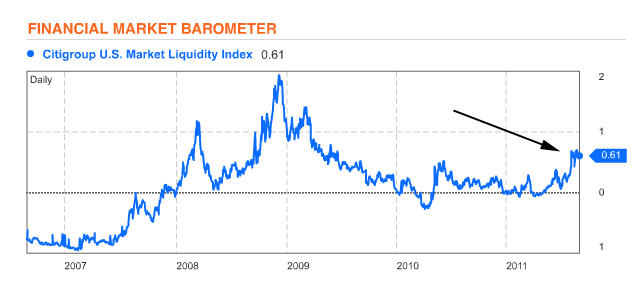
Here’s the Citi liquidity index, also a molehill:
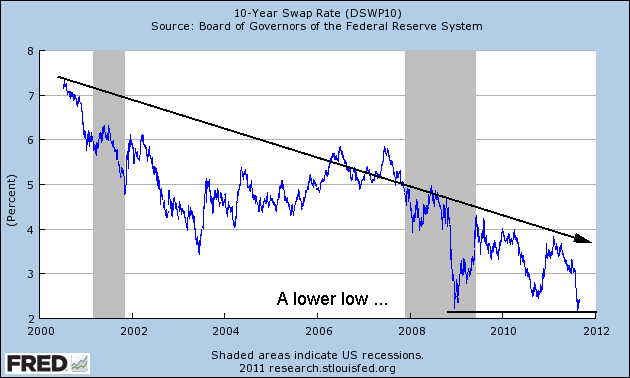
Figure 3: liquidity as indicated in options and VIX is tightening more. That recession looks ominous. There have been two reasons for recessions in post-war America: high money/credit costs and fuel constraints. Money costs would be high if there was a lot of business activity and demand for credit but a look at longer maturities suggests there will be no business at all in ten years!
Figure 4: This is the 10-year swap from St. Louis Fed (FRED): traded within the money markets. The 10-year Treasury note now yields less than 2%. With high unemployment (meaning fewer customers for discretionary goods and services) along with rumors of more quantitative easing and targeted longer rates from (over-extended) central banks, the expectation is for recession.
A ‘double dip’? Only if the world’s economies have escaped the first dip! What has been happening has been a decline in discretionary fuel demand due to high fuel prices alongside high credit costs: (Click on chart for big)
Figure 5: This chart from Doug Short compares WTI crude price with gasoline prices nationwide from Gas Buddy. Keep in mind the WTI price has disconnected from real-world prices (probably due to manipulation within the futures market) but the + $85 per barrel price level indicated on the chart puts the world’s economy into the ‘pain zone’. This price point is where businesses whose profits depended upon oil costing from $20 to $50 per barrel have already failed, leaving survivors able to profit by cutting staff, borrowing cheaply from the government, having predatory stances with regards to their customers: by pushing energy costs onto third-parties for the time being.
Between $50 and $85 per barrel, the fuel prices slowly bleed businesses which endure as long as they are able to borrow. The effects of both costs amplify each other to the point of surrender — and demand destruction. $50 to $85 isn’t outright lethal as the credit failures keep a temporary lid on fuel prices. Adding credit — as has been done in the name of ‘easing’ and ‘stimulus’ since 2009 — has allowed the fuel price bid to rise where the combined costs are becoming unbearable.
Below $50 is where the World’s economies grow. Note the ‘Green Shoots’ period during the Spring of 2009 when West Texas crude was less than that $50 per barrel. Kiss that goodbye, Dude: the only way back to sub- $50 is deflationary collapse and economy-wide demand destruction.
As has been noted here frequently, the high cost of fuel is both the result increased physical demand relative to supply along with the availability of credit. Fuel is allocated by ‘rationing’ access to credit or its being made available rather than by the more direct rationing access to fuel, itself. In the asset markets, fuel becomes collateral for more credit, which allows for increased bid. The crude oil asset price in the margin markets runs away from the level that can be supported by user markets. The cost of credit or margin is embedded in the fuel price, which cannot be supported by fuel use which is nothing more than waste.
In the run-up to the 2008 price spike, the USA and the rest of the world was flush with credit, looking for a place to hide. Funds were ‘rolled’ by hedge funds and institutional traders from speculative instruments — such as mortgage-backed paper — into crude futures. Crude was a ‘sure thing’ with bolting Asian demand outstripping physical supply. The result was a rapidly expanding upside-down paper crude pyramid perched upon a shrinking base of available physical crude. The paper crude market collapsed when physical demand was destroyed by the high prices amplified by the paper/credit crude bubble.
The obvious question is, where do we go with this? More demand destruction is taking place now because of the high prices since last summer. There is a consolidation in the fuel waste ‘industry’ as the marginal dudes are priced into unemployment and ruin. Meanwhile, the establishment refuses to take energy constraints seriously: “Drill, Dude, drill”!
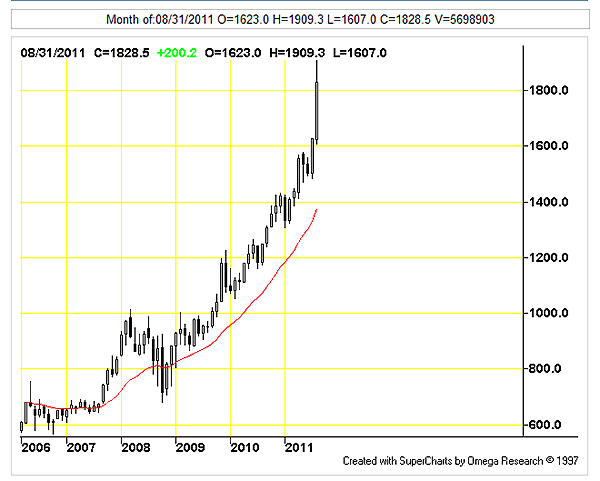
The only solution is conservation: the voluntary removal of demand. This cuts against the progress narrative and industrial economics which requires constant ‘growth’. Unfortunately, the alternative to conservation is that events will reduce demand in a chaotic and non-linear fashion. Here is one more chart, this is what conservation looks like:
Figure 6: If you haven’t guessed, it’s a very popular natural resource material, the difference between this and the ‘Master Resource’ is that it’s useless for anything other than a paperweight. The increase in price seen here will be mirrored by that in crude, the difference is that a price above a certain point emerges as demand destruction for crude products.
Nobody uses crude for a paperweight, Dude!
