 James Benning ‘Ruhr’
One of the best data websites on the Internet is John Williams’ Shadow Government Statistics. The premise thereto is that the official offerings are “questionable”.
No kidding?

Look at the trade balance. It isn’t the Chinese that are the deficit problem for the USA it is Nigeria, Canada, Mexico, Angola, KSA and Kuwait! We pretty much hold our own in the trade for goods, we are undermined by our insatiable thirst for crude.

Observe that the last period of sustained economic growth took place during the period from 1997 (roughly) to 2001. There was another ‘blip’ of real growth in 2004. These periods coincided with cheap crude availability particularly during 1998 when the price of oil was below $15 a barrel. Also notice in real terms the steady trend downward of GDP growth in real terms since this time series began. We as a nation have become less productive in real terms over time despite massive increases in debt and fuel consumption.

This is the EIA weekly price chart for crude imports worldwide. Notice how prices have declined since the peak in 2008. Are prices declining because of credit- driven deflation in the economies or are the economies declining because of high fuel prices?
If fuel prices are the cause there is little that can be done with credit that can help the economies except to create more credit bubbles. What can these do but drive up (fuel) costs to a higher level of unaffordability?
Isn’t rationing rationing? In any scheme, someone is required to do without. Why is credit rationing preferred to the simple, common sense conservation approach which is less painful than bursting finance bubbles?
The majority of analysts believe that crude oil is simply another input like copper or wheat. If crude becomes in short supply, another fuel of some kind will replace it, all that is required is high enough prices to fund the replacement. They believe our economies are declining because we are carrying unserviceable debt. They suggest debt remedies will cure the economic disease and allow a return to growth (leaving aside the inherent contradictions of that approach).
What if the opposite is true; that oil price increases since 1998 have not only failed to bring meaningful alternatives to market but have also bankrupted those at the fuel- use margins driving down demand? What if debts are unserviceable because there aren’t enough returns from fuel use at the high real input prices to allow debt service?
Prior to 2008 there were sufficient returns along with enough legacy credit to allow the US economy – along with China’s and the Eurozone’s – to endure stagnating employment and business environments while still enjoying some illusion of growth. That funds were available to support oil consumption is obvious in the $100 annual oil price commanded in 2008. Since then oil- propelled production has declined, along with real GDP growth and aggregate demand while unemployment has increased. Debts have been shifted from the private to the government sectors and a scaffold of ‘stimulus’ and central bank work- arounds have been substituted for organic, top- line returns.
Here’s a final chart:
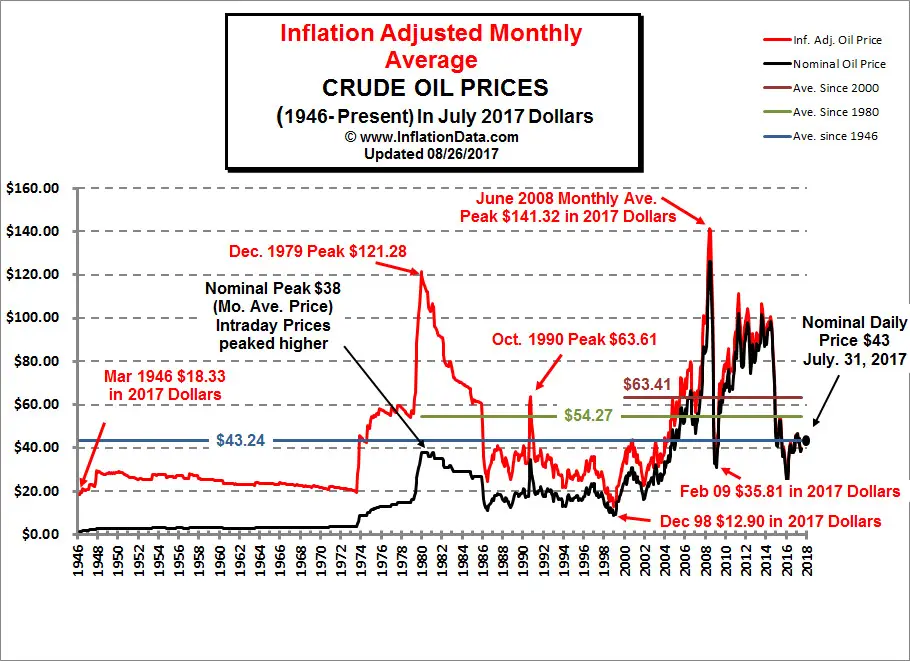
This is a chart of crude prices adjusted for inflation/deflation. Last year’s average price was less than $70/barrel and this year’s will likely be around $75. Are these prices ‘the new low’ or do they represent something else? Oil prices can be too high and too low at the same time.
Something to think about …