Take a look @ Bloomberg’s energy complex trading: The energy complex is getting hammered:
Energy
| PRICE* | CHANGE | % CHANGE | TIME | |
|---|---|---|---|---|
| BRENT CRUDE FUTR (USD/bbl.) | 109.350 | -11.840 | -9.77% | 15:21 |
| GAS OIL FUT (ICE) (USD/MT) | 908.500 | -93.250 | -9.31% | 15:19 |
| HEATING OIL FUTR (USd/gal.) | 286.420 | -27.880 | -8.87% | 15:21 |
| NATURAL GAS FUTR (USD/MMBtu) | 4.260 | -0.317 | -6.93% | 15:21 |
| GASOLINE RBOB FUT (USd/gal.) | 306.570 | -25.680 | -7.73% | 15:21 |
| WTI CRUDE FUTURE (USD/bbl.) | 98.750 | -10.490 | -9.60% | 15:20 |
Energy prices have been on a tear since last Fall with the Brent futures trading in the $130 range. This has indicated a dollar losing almost 40% of its value relative to crude since that time period along with much hand-wringing. Commodities are still in an uptrend but a lot of air has been let out of the complex starting with silver, beginning last week.
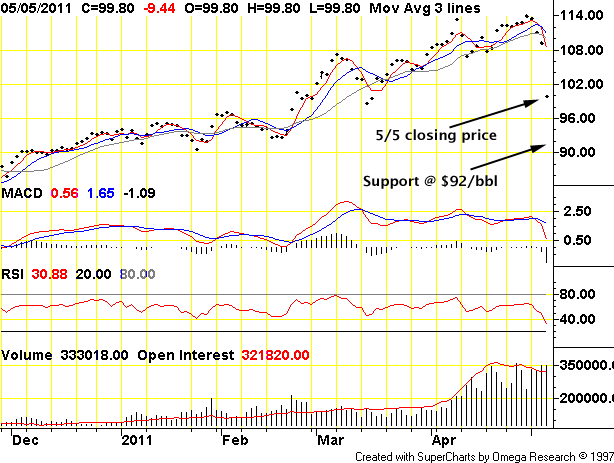
This is the daily front- month chart of West Texas Intermediate crude, courtesy TFC Charts. Note the sharp declines including today’s drop. The current price is still somewhat above the trend line as the last few month’s run have amounted to a ‘Super- Bull’ market. That the various moving averages have all been crossed. Market variability is reflected in the chart which indicates corrections taking place within the trend. It’s important to watch and see if selling continues and the trend line/price support are taken out.
I updated the chart b/c the original was outdated before I finished the post!
The commodities are all overbought, over- bullish with few remaining with cash left in the market to buy. A liquidity shortage has been noticeable for the past few months and noted here @ Economic Undertow. What sells is credit and its cost is not known for the moment. It may be the cost for this last ‘hurrah’ of easy money and nominally cheap finance credit will be the collapse of one or more large banks, perhaps in Europe or Japan, then spreading to China and the US.
The issue for US banks is whether their immense positions (mostly short) in commodities are properly hedged. We are all going to find out the hard way.
If a single, large bank failure takes place, can others be far behind? If a failure occurs within the current tidal onrush of central bank credit, what more can central banks do? What more can the CB’s provide in the face of desperate demand for liquidity but wring their hands? Is the Fed able to expand its balance sheet — even temporarily — to $20 or $30 trillion or more? What sort of collateral can it accept as good? What good collateral can be had that has not been posted elsewhere?
Is not the shortage of good collateral visible in the rising price of gold and silver?
The (foolish) assumption is that resource constraints will bring forth endless money/credit creation even as the constraints effect economic output at the same time. How can constrained economies afford to create credit? This is the question that few bother to answer: the assumption is that future economic growth will somehow magically appear to provide the means to service the debts.
What the central banks and finance have provided for the establishment has been trillion$ in bridge loans.
Triple- digit oil is somehow supposed to pay for itself, but how can it? As during the real estate bubble and collapse the rationalization is the same as for the current bubble(s): “they (‘They’) aren’t making any more land/oil/gold/silver!” as if all that matters is a cycle of trades made between one speculator and another with actual use as an afterthought!
The final use of a good has to pay for it. The speculative cycle(s) have made the goods use unprofitable: now what?
No one is making any more people with money, either. Additional credit prices the goods remaining on the marketplace out of reach of ordinary use (waste) and economic activity grinds to a standstill as a consequence. This is what demand destruction actually represents.
If economic activity cannot profit by $75 oil, what can it do with $130 oil? Perhaps we shall see: this may be a correction in a longer- term trend toward retesting the 2008 crude oil price of $147. If the world’s economies stagger under $130 oil the chance of the higher price slips out of reach.
The place to keep a focus is on precious metals which have been leading commodities since the surge in prices began. Unlike crude, PM’s are more relevant to finance markets rather than economic markets and have not been subject to a bubble as was the crude market in 2008. While $200 or even $20,000 silver would be inconvenient to businesses that rely on it such as jewelry or electronics, $200 crude would cause a business coronary as business input costs would instantly price business’ goods out of reach of cash- strapped customers. Right now, silver is getting hammered, down 7% @ $34/ oz. This appears to be speculators abandoning a ponzi like rats abandoning the sinking ship.
It’s possible the commodities’ bubble has more room to run. With the markets beginning to price in credit restraint and a possible slowdown in China, a ‘greater bull’ seems less and less likely.
With the crude/dollar trade being the ‘monetary exchange measurement’ that matters, the new strength to be found in the dollar will ricochet through markets that profit from a weak dollar such as the dollar/yuan carry, the dollar/euro F/X cross, most equities trades along with the constellation of derivatives that orbit these trades.
What is the trigger for the decline, other than input costs that have risen beyond affordability? A possible unraveling of the Great China Property Bubble is a good place to start.
Beijing March New House Prices Plunge 26.7% M/M:BEIJING (MNI) – Prices of new homes in China’s capital plunged 26.7% month-on-month in March, the Beijing News reported Tuesday, citing data from the city’s Housing and Urban-Rural Development Commission.
Average prices of newly-built houses in March fell 10.9% over the same month last year to CNY19,679 per square meter, marking the first year-on-year decline since September 2009.
Home purchases fell 50.9% y/y and 41.5% m/m, the newspaper said, citing an unidentified official from the Housing Commission as saying the falls point to the government’s crackdown on speculation in the real estate market.
Beijing property prices rose 0.4% m/m in February, 0.8% in January and 0.2% in December, according to National Bureau of Statistics data.
The central government has launched several rounds of measures since last year designed to cool the housing market, though local government reliance on land sales to plug fiscal holes mean enforcement hasn’t been uniform.
This is one report and one market which does not a trend make, but the undertow can be felt. With the Chinese (pretending) to tighten and the flow of American and European cash to China slackening, the outcome could be the long- dreaded China slowdown or hard landing.
A slowing flow of carry- trade cash would be self- reinforcing. Potential gains from the carry would vanish parallel with greater foreign exchange risk. The China carry trade is yet another finance ponzi scheme: those who ‘invested’ in China early in the game have profited at the expense of latecomers. The smart money more than likely have already exited, pocking profits on investments priced in a gaining yuan. If the carry implodes, any F/X gains would be balanced by real losses on investments — real estate and manufacturing enterprises — ‘Made in China’.
I personally think Chinese authorities will continue to try to support their bubble economy by increasing the money supply by any means available even if it means more hyperinflation. Unfortunately, China cannot escape the real world constraints imposed by higher energy costs which result from the same hyperinflation. If these are not imposed upon the Chinese themselves, they will be exacted from their overseas customers.