
Figure 1: the Triangle of Doom® Brent crude futures by CommodityCharts.com. Where we are within the triangle is a bit like Alice half-way down the rabbit hole. What is at the other end?
Americans don’t want to know as their precious cars slowly slip away … along with the suburbs, the jet vacations to Las Vegas and Orlando, the college educations for the children, the ‘money-for-nothing’ investments, the privilege and the absence of accountability. Right now the car and the cost of fuel is pricing everything else out of reach … and the Americans are too dumb and TV-addled to recognize it.
Drillers are able to borrow from finance for modest periods of time. They have done a very good job promoting their latest speculative efforts and have been able to find hundreds of billions of dollars in new financing for plays that are marginal compared to previous plays. After the drillers borrow the customers arrive to retire the drillers’ loans with their own … either that or the drillers go out of business.
Because the new plays are more complex and difficult to exploit, the amounts needed by the drillers steadily increase. Fifty years ago a dollar would return fifty dollars or more worth of new crude, presently a dollar returns ten dollars or less. This diminution of returns is the consequence of our society’s extraction- and consumption success. No greater drilling effort … or monetary ‘cheating’ … can retrieve lost productivity. Waste has a lower entry cost than drilling; what we do best is waste more, faster.
Customers ultimately meet the cost of petroleum, they must borrow to do so. Meanwhile, what is borrowed for is simply thrown away. Oil in the ground is perpetual but its use is one-time and instantaneous. Because fuel has historically been improperly priced as a ‘loss-leader’ for the rest of industry there is no incentive to find other uses but to burn it for pleasure and label the process ‘work’. This lie has become very costly over the long term,
Continued borrowing in ever-increasing amounts of fuel slowly pauperizes the oil consuming customers who are ruined by their goods’ absence of return. Besides fuel, customers must borrow to pay for cars, freeways, parking lots, insurance companies and militaries. Think of energy components as accounting entities: the cost of fuel- plus the cost of credit needed to gain the fuel are on the ‘expense’ side of the ledger, the returns from using the fuel, the cars, freeways and whatnot are entered on the ‘income’ side, these two entities added together must equal zero. However, fuel use offers minimal returns; driving the car cannot pay for the car or anything else. Balancing the national energy ledger requires borrowing; eventually the account becomes nothing but a mass of bad loans.
This is how the world has accumulated so much debt, not social programs for humans but credit subsidies for the auto- and auto related industries and the absence of return for these things’ users. Right now, the arguments about continuing social programs are about choosing what to jettison in order to keep driving cars and wasting fuel. This is a foolish choice because the onrushing costs of subsidizing the car industry and fuel supply are unsustainable. Regardless of what choice is made the end result is insolvency and deleveraging … and fuel shortages.
A too-high price for fuel causes distress within the credit system: consider the too-high price to be the ‘upper bound’ where enough damage is done to the economy to destroy fuel demand. Since 2008 there has been an observable series of stepwise declining high fuel prices along with repeated crises; each succeeding price lower than those preceding, each crisis being more damaging. The world is becoming poorer every day … made so by the marching real costs of credit and petroleum.
The demand destruction process is incremental and cumulative: over time more customers become insolvent and can no longer borrow. As a consequence, governments have become the world’s borrowers of last resort. They are the ‘last man standing’ able to indirectly subsidize the petroleum industry. Governments and their central banks have become the rear guard of the waste-making status quo even as their own credit costs mount.
The next step down the rabbit hole is for governments themselves to become insolvent … and for the fuel-waste regime to simply fall apart, as it must. This will occur even as the extraction industry by itself appears to be robust … due to its own self-aggrandizing propaganda and wishful thinking on the part of consumers.
Here’s a note by Jeffrey Brown on rising costs, (Peak Oil Barrel/Ron Patterson):
Recent Global Annual Crude Oil Prices Versus Global Net Exports of Oil and Rising US Crude Oil Production.We have of course seen a cyclical pattern of higher annual highs and higher annual lows in global (Brent) crude oil prices in recent years, but I think that the rates of change between successive annual price lows, or troughs following annual oil price peaks, is very interesting.
Peak to Trough Annual Brent Crude Oil Prices, 1997 to 2013
- 1997: $19
- 1998: $13
- 2000: $29
- 2001: $24 (1998 to 2001 rate of change: +20%/year)
- 2008: $97
- 2009: $62 (2001 to 2009 rate of change: +12%/year)
The 11 year 1998 to 2009 overall of change in trough prices was 14%/year.
- And then we have 2012 to 2013.
- 2012: $112
- 2013: $108 (Est. price)
Based on estimated price for 2013, the four year 2009 to 2013 rate of change in the trough price would be 14%/year ($62 to $108).
The long term 15 year 1998 to 2013 rate of change in trough prices would also be 14%/year ($13 to $108).
While currently rising US crude oil production has certainly contributed to keeping annual Brent crude oil prices on a plateau of about $110 for three years, something that is not widely understood is that the annual volume of oil lost to declining production from existing wells is almost certainly increasing at a rapid clip.
…
Assuming an average production rate of 7.5 mbpd (million barrels per day) for 2013 and assuming a 10%/year decline rate from existing oil production, we would need to replace the productive equivalent of 100% of current US crude oil production over a 10 year period, everything from the Gulf of Mexico to Alaska, in order to maintain 7.5 mbpd.
If we assume that the the decline rate from existing US oil wells increases from about 10%/year in 2013 to 20%/year in 2023 (a more likely scenario in my opinion), we would need about 12 mbpd of new production in 10 years, in order to maintain 7.5 mbpd for 10 years. Under this scenario, the annual volume of oil production lost due to declining production would increase from 0.75 mbpd in 2013 to 1.5 mbpd in 2023.
Even if the US can come up with the needed credit, it is hard to see where the needed oil will come from.
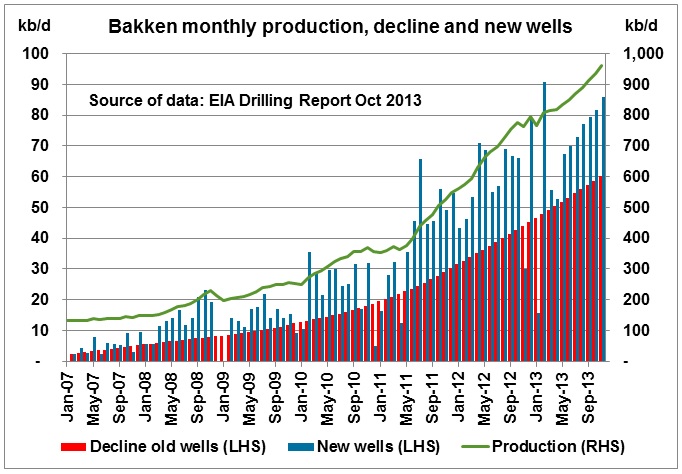
Figure 2: decline rates vs. number of wells and extraction rate of new well @ Bakken from EIA, (from Matt Mushalik/CrudeOilPeak). As tight wells age, the rate of depletion increases. More wells must be drilled to keep pace with depletion along with even more to increase ‘production’.
It is not simply age that causes wells to deplete but our restless urge to waste capital for fun, driven by a false understanding that if we do not waste, then someone else will waste in our place.
A proverb in the futures’ markets is, “the solution to $10 corn is $10 corn …” The high priced corn is an incentive for farmers to bring more to the market which would drive prices lower. The energy analog is, “The solution to waste is waste …” Given accelerated rates of waste the outcome is resource capital exhaustion, bankruptcy and the inability to waste at all … not the best way to run a business.
Please note: After November 30 you will be required to be registered here to comment. Please sign up now if you haven’t already! Please check registration guidelines.