
The oil market has been restive of late as the Eurozone Stress Tests and various loud noises from Brussels have ‘removed’ the risk associated with the euro.
This is bullish for oil as the elimination of risk means lots and lots of aimless driving in circles by every life- form able to reach the pedals, burning gas and money. Of course, all of this is bullish for stocks! Happy days are here again!
Is oil poised to make another run at $90 a barrel?
Recall in May when both stocks and commodities (along with gold) were making bull runs before the Greek Debt Crisis pulled the plug. Or, was it the $87 oil that pulled the plug?
Here is the NyMex front month weekly chart with the S&P 500 weekly superimposed:

The big question is whether there is enough money in the various economies to support $90 oil? You will notice that the highest trend prices over time since Summer of 2008 have declined from +$145 to +$87 to the current +$78. The trend is lower highs, suggesting less funds available for oil over time. If the current price is part of that longer term trend. the world is becoming poorer.
Business activity is shrinking, here’s Ambrose Evans- Pritchard:
Drip after drip of deflation data
Today’s release on manufacturing activity by the Richmond Fed is pretty ghastly, as you would expect given that the effects of fiscal stimulus are now wearing off at accelerating pace – before the happy handover to the private sector is safely consummated – and given that the structural East-West imbalances that lay behind the global crisis are getting worse again.
The expectations index for the US 5th District is crumbling:
This follows yesterday’s horrendous fall in the Texas business activity index from the Dallas Fed, which fell from -4 in June to -21 in July. “Thirty-one percent of firms reported a worsening of activity, up from 22 percent in June,” said the bank.
Texas New Orders were -9.6 in July, -8.2 in June, and +15.8 in May.
Capacity Utilization was -0.6 in July, +2.7 in June, and +18.7 in May.
This of course is why Fed chair Ben Bernanke has been giving strong hints of QE2 (helicopters again) if necessary.
Forgive me if I am becoming a “leading indicator” bore but these turning points in the cycle are fascinating. The US Conference Board’s index of consumer confidence fell again in July to 50.4 after plunging in June.

Is deflation ‘dripping’ because the price of oil is too high relative to the price received for goods and services?
Real estate in the US isn’t so hot, either. This is from Bill McBride (Calculated Risk):
2nd Half Slowdown Update
“For me a double-dip is another recession before we’ve healed from this recession … The probability of that kind of double-dip is more than 50 percent. I actually expect it.”
Professor Robert Shiller, July 27, 2010 (via Reuters: Chance of Double-Dip US Recession is High: Shiller)Now that the 2nd half slowdown is here, it might be worth reviewing some of the arguments for a slowdown:
1) less Federal stimulus spending in the 2nd half of 2010.
The only additional stimulus has been the extension of the qualifying dates for unemployment benefits. Even with this extension, the overall stimulus peaked in Q2 or possibly Q3.
2) the end of the inventory correction.
This is pretty clear in the data, and we are seeing a slowdown in growth for the manufacturing sector (but not contraction). This is one of the reasons I’m tracking the regional manufacturing surveys so closely this week.
3) more household saving leading to slower growth in personal consumption expenditures.
This still isn’t clear, although the personal saving rate
ticked up in May.4) another downturn in housing (lower prices, less residential investment).
Could it be that personal savings rate is a reflection of the declining value of most ‘goods’ and assets measured against the value of cash? Dollars priced in oil are worth something. How much are Chinese- made consumer goods worth?
How much are other, non- oil assets worth? Wouldn’t you hold onto your money?
Would you spend your money and benefit the thieves who have destroyed the economy or keep it and benefit yourself?
Of course, if you don’t have money coming in, you don’t have anything to spend! The employment situation is deteriorating. Here is Paul Krugman:
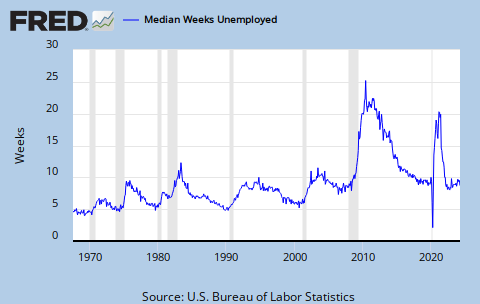
Quite. I really don’t think people appreciate the huge dangers posed by a weak response to 9 1/2 percent unemployment, and the highest rate of long-term unemployment ever recorded:
Right now, I’m reading Larry Ball on hysteresis in unemployment (pdf) — the tendency of high unemployment to become permanent. Ball provides compelling evidence that weak policy responses to high unemployment tend to raise the level of structural unemployment, so that inflation tends to rise at much higher unemployment rates than before. And the kind of unemployment we’re experiencing now, with many workers jobless for very long periods, is precisely the kind of unemployment likely to leave workers permanently unemployable.
And there are already indications that this is happening. Bill Dickens, one of the people has who worked on downward nominal rigidity, tells me that the Beveridge curve — the relationship between job vacancies and the unemployment rate — already seems to have shifted out dramatically. This has, in the past, been a sign of a major worsening in the NAIRU, the non-accelerating-inflation rate of unemployment.
I never heard of the Beveridge curve before – you learn something new every day – but the sense of the situation suggests that the structures that supported jobs pre- crisis have been stranded. Maybe Prof. Krugman can post Bill Dickens’ version. No income means less purchasing power and declining prices including those for fuel.
Household net worth has deteriorated (via Ed Harrison):
There is a new graph on the internet that will be seen and discussed at length in the coming days and weeks. It shows how household net
worth has changed over the past 59 years.The graph below, originally from Macro and Other Market Musings, has been annotated by Barry Ritholtz at The Big Picture.
What is evident in this graph is another appearance of the effects of the two historic bubbles of the past half century. That the household net worth experienced bubbles is evident by another annotation of the graph that I have performed, below:
The relationship between household net worth and disposable income has returned to what I have labeled as the “normal range” for the 59 years. I think this is reasonable because 56% of the time the ratio has been between approximately 465% and 515%. I have labeled the years between 1973 and 1987 as a “depression” in the ratio (25% of the time) and the recent bubble years occupy the remaining 19% of the time.
It is worthwhile to also look at how real disposable personal income has changed over this time interval. The St.
Louis Fed FRED data base graph is shown below with the author’s notations to show the various time periods identified in the graph above.

There are only a few things to note about the real disposable personal income numbers, and none will be surprising to readers with any awareness of economic issues. These are:
- The early normal period (1952-1972) is estimated to have an average real annual growth rate average between the two horizontal reference lines.
- The second normal period (1988-1996) also has an average between the two horizontal reference lines, but obviously lower than the earlier normal period.
- The third normal period (2008 to date) has no readings between the two horizontal reference lines; clearly the recent drop in the ratio in the earlier graphs is due to a large drop in household net worth and not from any significant increase in disposable personal income.
- The depression period (1973-1987) also had an average well within the area between the two horizontal reference lines, but lower than the preceding normal period and higher than the subsequent normal period.
- The period of the two bubbles (1997-2007) clearly has two parts; before 2002 the average is clearly in the area between the two horizontal reference lines; from 2003 on, the average is very near or slightly below the lower line.


